Project
Source Data
The data comes from an Enterprise Resource Planning (ERP) system for a fictitious company called Wide World Importers.
There are a total of 4 schemas, 29 tables, and is completely normalized.
List of tables:
| application | purchasing | sales | warehouse |
|---|---|---|---|
| cities | purchase_order_lines | buying_groups | colors |
| countries | purchase_orders | customer_categories | package_types |
| delivery_methods | supplier_categories | customer_transactions | stock_groups |
| payment_methods | supplier_transactions | customers | stock_item_holdings |
| people | suppliers | invoice_lines | stock_item_stock_groups |
| state_provinces | invoices | stock_item_transactions | |
| system_parameters | order_lines | stock_items | |
| transaction_types | orders | ||
| special_deals |
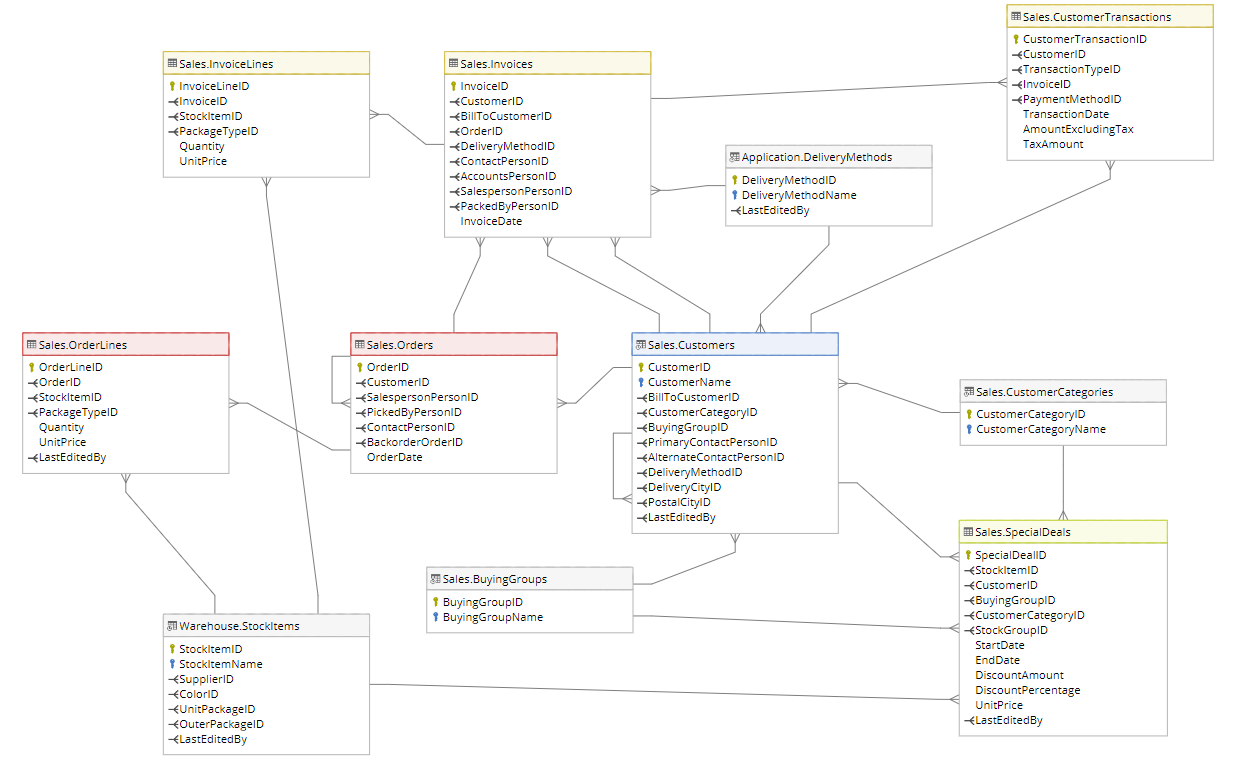
The Entity Relationship Diagram (ERD) for the entire dataset is very complex and so below is a just a sample the 'Sales' schema (taken from here).
The Business Requirement
The business scenario that was chosen was that the Sales team wanted insight into how much revenue was being made throughout the year and have the ability to break it down by customer, supplier, product, as well as knowing which sales person should get credit for the sale.
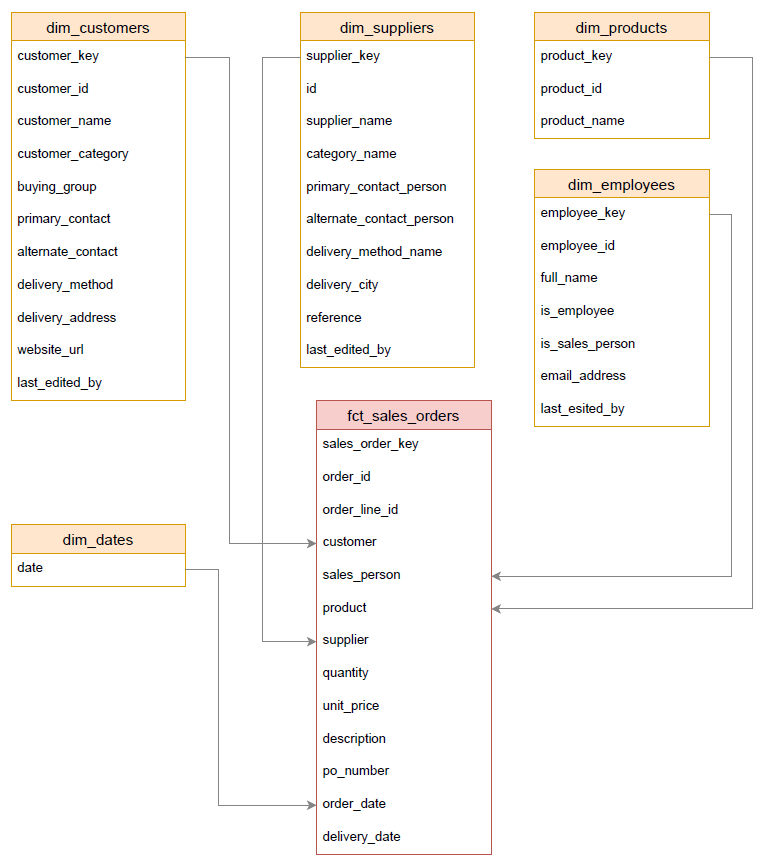
The Implementation
Based on the above business requirements the following dimension tables were identified:
- dim_customer
- dim_supplier
- dim_product
- dim_employee
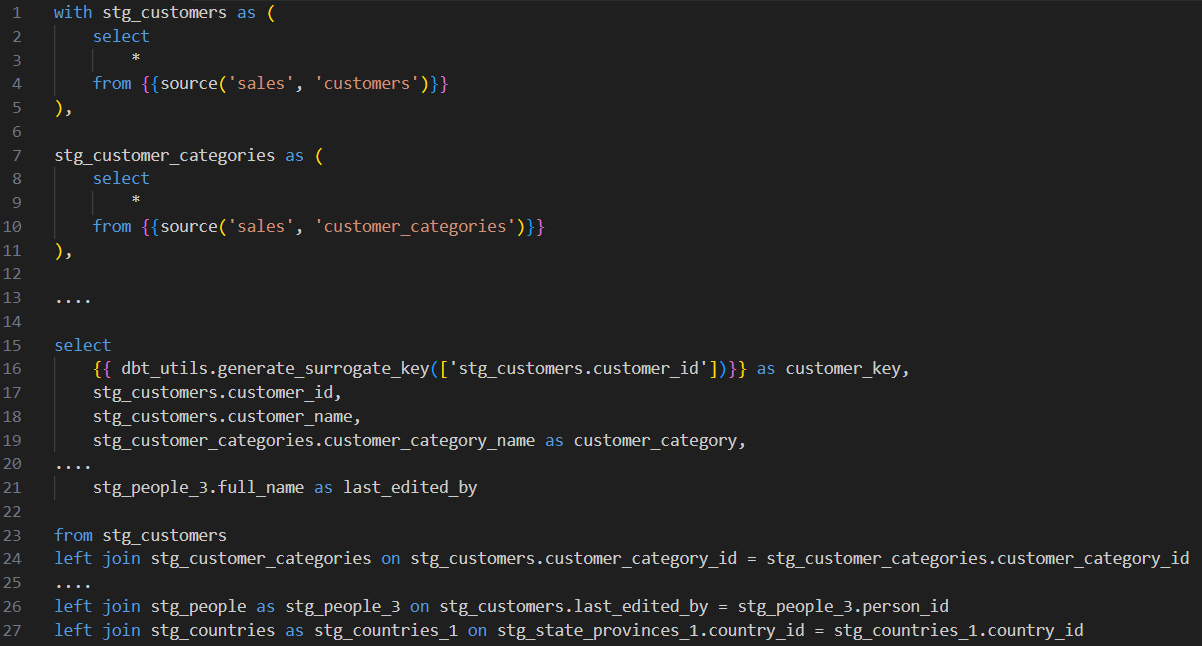
Sample of dim_customers:
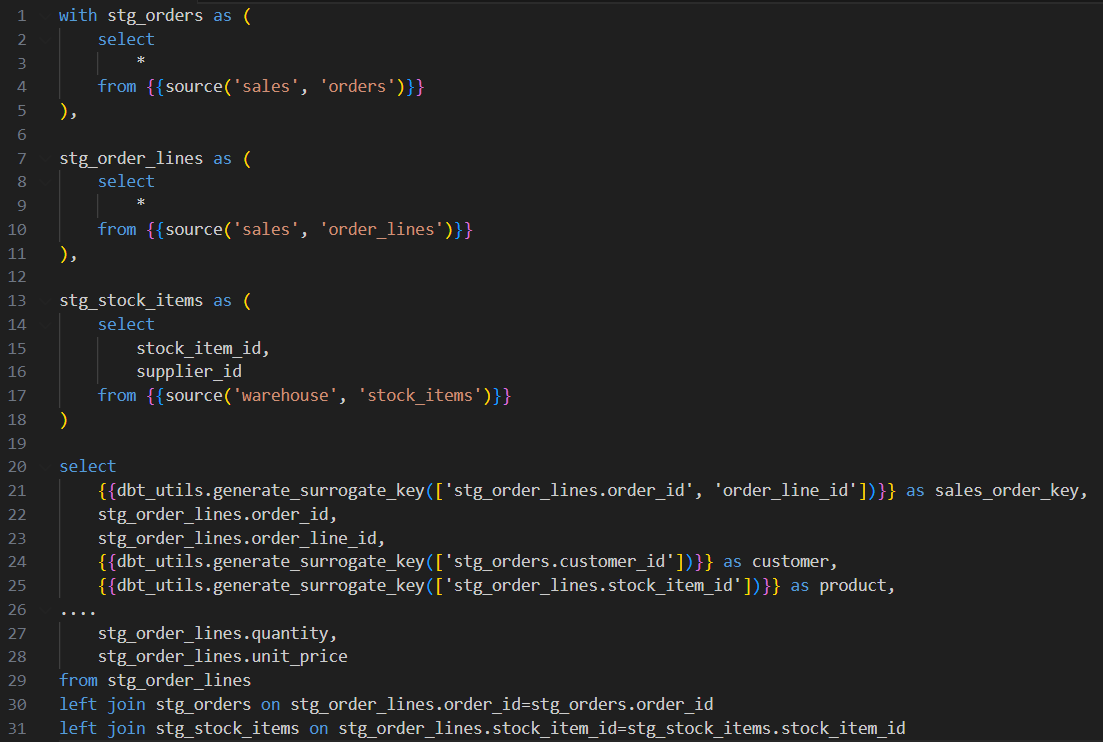
For the fact table, the ‘order_lines’ table provided the most granular details for each order such as which product, the quantity, and the unit-price. The ‘orders’ table contained the neccesary header info and thus was joined to the details table.
Sample of fct_sales_orders:
The Result
The newly created tables now formed a ‘star-schema’ for the sales transactions to be easily analyzed.
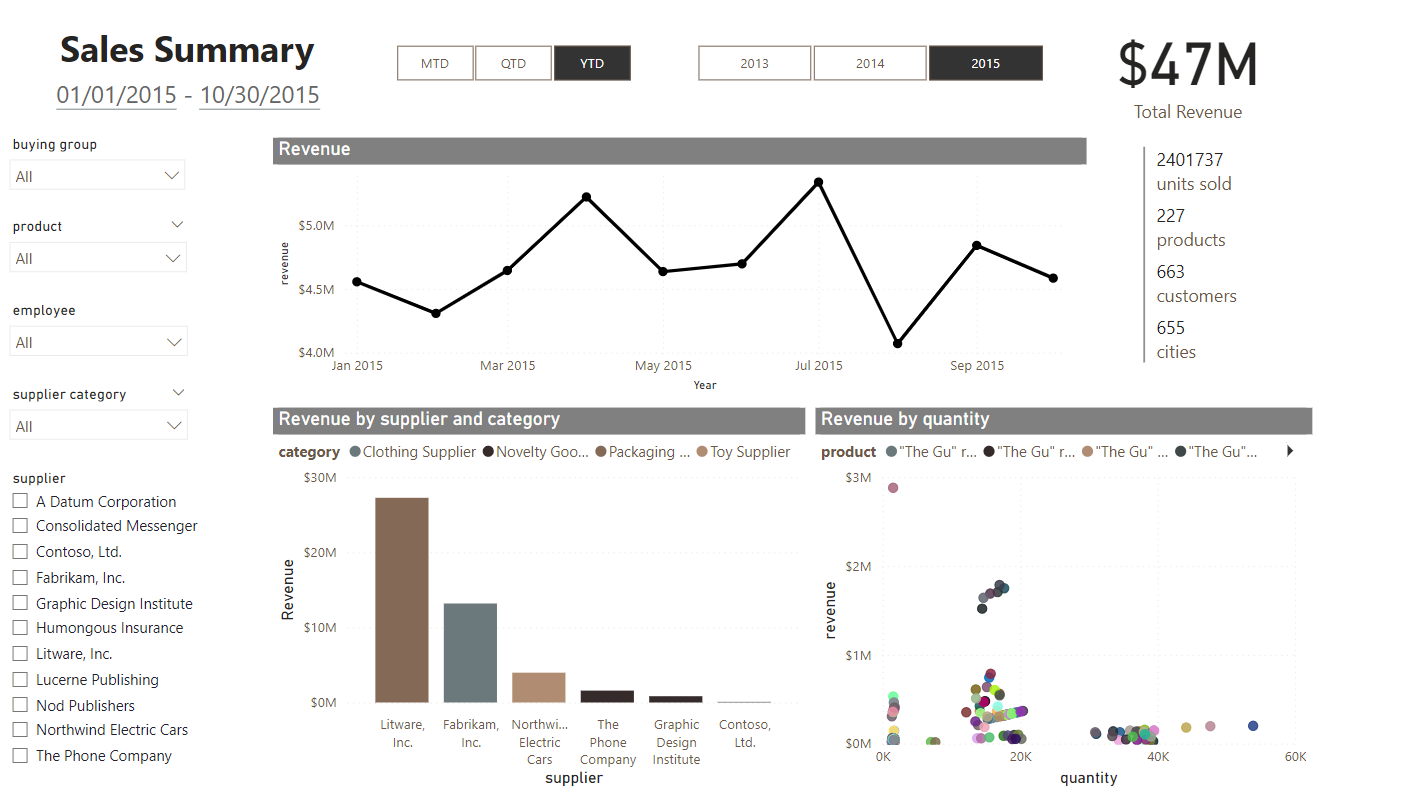
Dashboard
A simple PowerBI dashboard built using the new tables: