CityBikes Dashboard
A simple ETL pipeline that fetches data from the CityBikes API and feeds an interactive dashboard. Allowing users to see public bike sharing availability in their area.
This was my first time using many of the tools used in this project thus the CityBikes API was chosen for its simplicity so that I could focus on progressing towards a working product. (using a different API in a new project is on the list for future work)
Architecture
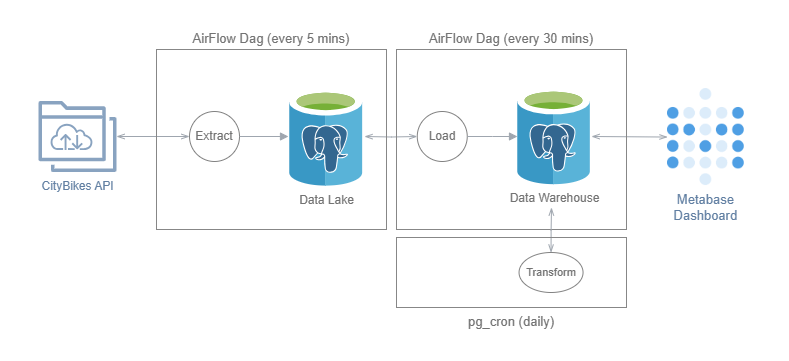
The pipeline begins with simple get requests to the API. These requests happen every 5 minutes and all responses are immediately stored in a single table. This single table was meant to act as a Data Lake so that I could preserve the raw data and have as many options later down the road for development and/or analysis.
The next step is to process the API responses from the previous step and update relevant tables. These new tables were meant to represent a Data Warehouse. There are two of these tables, one for each API endpoint, which we will go over later.
The last step is a transformation step where a list of transformations are performed on the two tables from the previous step to satisfy reporting needs.
The last two steps currently run every 30 minutes to reduce resource costs.
Finally, a Metabase instance is spun up and connected to all three database tables which is used to build the dashboard.
The Data
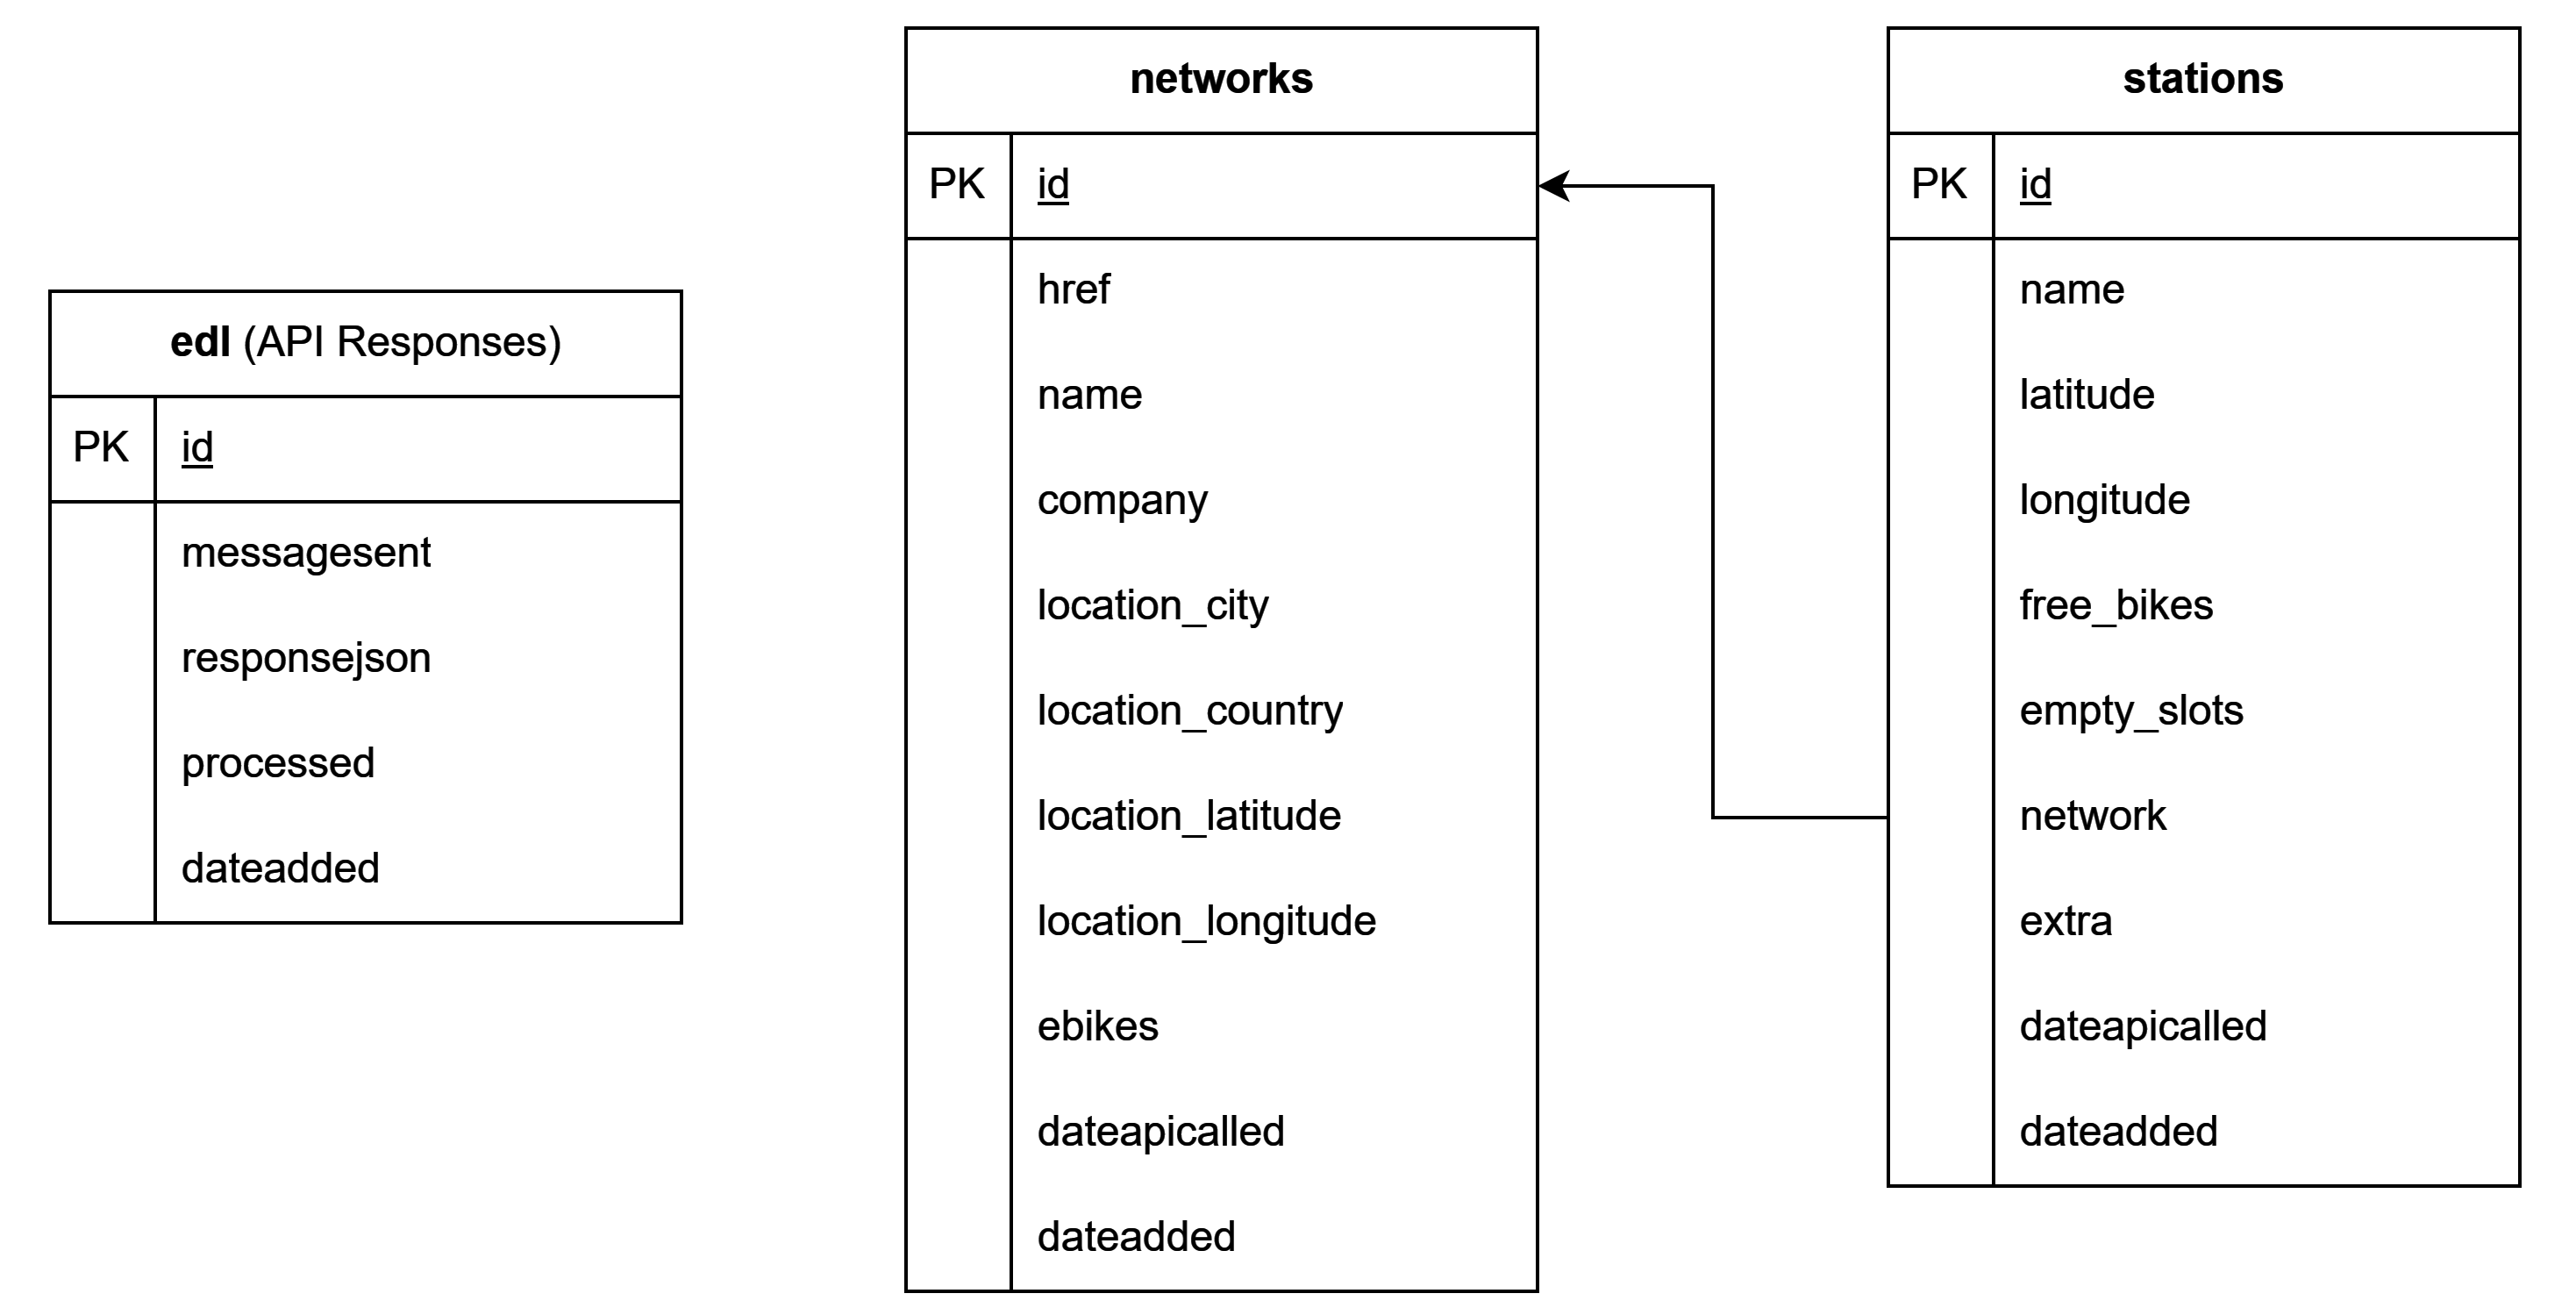
The CityBikes API has two different endpoints that are both used here.
- Networks - returns all current Networks and some basic info for each. Generally there is only one network for a given city.
- Stations - returns all stations, their basic info, and their inventory for a given network.
Both endpoints are queried every 5 minutes but the 'Stations' endpoint is queried multiple times (once for each city we want to query). The resulting JSON responses are all stored in the same table labeled 'edl'.
While the 'Stations' data changes much more frequently than the 'Networks' data, both of their tables are implemented as Type 2 SCD's, adding a new row each time there is a change along with a timestamp.
Infrastructure
The majority of code written to facilitate the architecture above is written in Python w/ Pandas.
PostgreSQL is used for all data storage.
Apache Airflow is used for scheduling.*
Metabase is used for data visualization and dashboard creation.
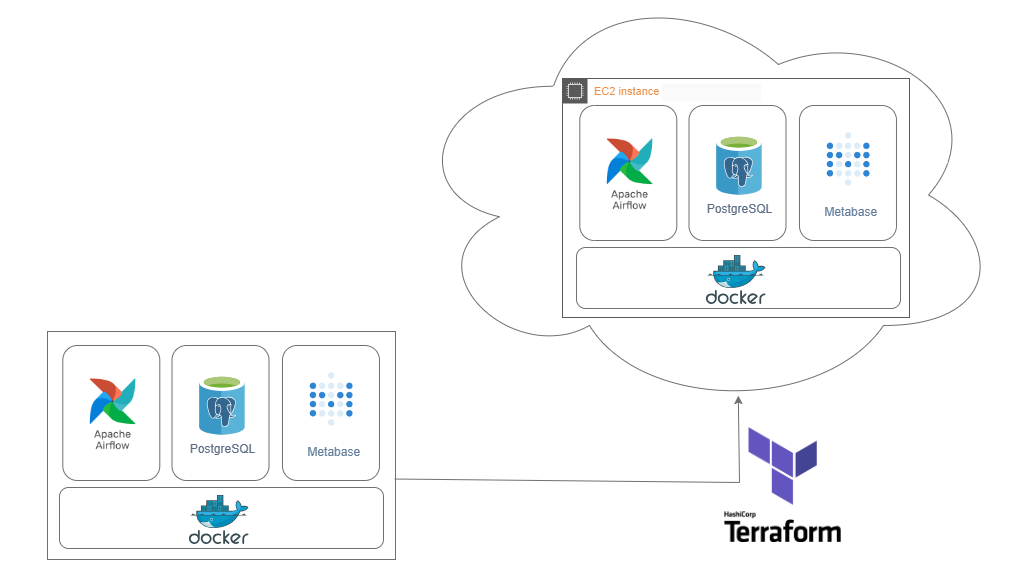
All these components are containerized using Docker and are currently running on an AWS EC2 instance as our production environment.
Github is used for version control and repository hosting.
Github Actions is used to automate CI/CD workflows such as consistency measures and pushing new changes to the production environment via ssh(rsync).
Terraform is used for IaC, storing all settings and parameters for the EC2 instance. Making it easy to modify the instance when needed.
* currently using Cron to save money as the Airflow instance was consuming too much RAM.
Dashboard
Below is a sample of some visuals below showing current inventory for bike sharing stations in Fort Worth and an anaylsis of the busiest times of day.
Click here to access the full dashboard: Link to full dashboard
Future Work
- Implement better practices for writing DAGs. Possibly reducing resource costs
- Change transformation scripts from Python to SQL
- Implement better software and data pipeline testing practices
- Find new API for new project that will have more complex modeling requirements